In partnership with Wolverley and Cookley Parish Council, we carried out a survey in Wolverley and Cookley to get a better understanding of local people’s housing needs.
The survey closed 5pm Friday 6 December 2024.
The feedback received will help shape future housing and planning policies for Wolverley and Cookley to make sure there are enough homes of the right type. The survey was open to current residents and any family members who have moved away and may be looking to move back.
We held drop in sessions for questions or help completing the survey. We also made arrangements for those who could not complete the survey online to complete it over the phone or using a paper version.
Wolverley and Cookley Housing needs survey report 2025
Sarah Cox ¦ November 2025 ¦ Housing Project Officer
1. Introduction
1.1 Housing needs surveys are undertaken to identify the local housing needs of a parish and the type and mix of housing that may be appropriate to meet these needs.
1.2 A housing needs survey was carried out during November and December 2024 in Wolverley & Cookley parish to establish what the expected housing requirements would be and to gain residents’ views for the parish in the next 5-10 years.
1.3 Letters were circulated to all households in the parish inviting the residents or those with a local connection to the town to complete an online survey. The information gathered from the responses has been used to complete our analysis for this report
1.4 Housing Need surveys are therefore a useful ‘snapshot’ of the local situation at a given point in time and can complement the existing housing need information held by the Council. This survey will be a useful tool for the parish council in assessing local housing needs.
2. Executive Summary
2.1 The results of the housing needs survey are detailed further on in this report however in summary:
2.2 There were 97 households looking to move, find alternative housing or need additional homes within the next 10 years. Some households will be looking for more than one additional home. Of those that responded, 33 could have their housing need met by natural churn and an additional 9 could have their housing need met by what is currently available on the open market equalling 42 households in total. This is obviously subject to the property being suitable, becoming available at the right time and being affordable for the household in question.
2.3 Of the 97 mentioned above and considering the 42 whose needs could be met by the open market and natural churn, the results indicate that a total of 70 new homes would be needed to meet the demand.
2.4 Of the 70 households that responded confirming they have or will have a housing need within the next 10 years, the majority advised that they will require a 2-bedroom property, this was followed by a 3-bedroom property with the highest property type being a house followed by a bungalow.
2.5 At the time of writing this report (November 2025), 52 properties were for sale in Wolverley & Cookley, and no properties were available to rent, 9 of these properties met the property size, type and cost bracket as indicated by the of respondents in the survey.
2.6 Therefore, it can be shown that in the next 10 years, 70 homes will be required in Wolverley & Cookley of which 53% households advised that they would want a 2-bedroom property and 30% would require a 3-bedroom property, 49% of the respondents advised they wanted a bungalow followed by 44% wanting a house. The highest need regarding tenure type is owner occupier at 69% followed by social rented 23%, with shared ownership at 4% and privately rented also 4%. Table shown in 30.15
2.7 Of the total households looking to rent a property (19) there were no available properties at the time of writing the survey. Of those looking to buy (48) only 9 could afford in excess of £500k which was the average available property price at the time on the survey. It should be note that respondents could select both rent and buying options. Therefore, when we take into consideration property prices and household income these results indicate a need for low-cost home ownership products or other forms of affordable housing within the parish.
2.8 In terms of meeting local housing needs, which will be a requirement for any unallocated sites, if we consider the ability to afford the costs across the requirement for 70 units, the split is shown below. For sites of six of more units there will also be a requirement to meet the 25% affordable split across 65/35 rent to shared ownership.
|
Tenure |
Number from survey |
Percentage split |
|---|---|---|
|
Owner occupiers |
9 (assumption made that of the 69% looking to move into owner-occupied tenure also include the 9 who can afford property prices) |
13% |
|
Shared ownership |
41 owner occupiers unable to afford open market prices and preference for shared ownership |
59% |
|
Social rented |
16 households require social rented properties |
23% |
|
Private rented |
3 private rented – assumption made both can afford local private rent levels |
4% |
3. Background
3.1 The 2021 Census advised that Wolverley & Cookley had a population of 5000, (51.6%) females and (48.4%) males (ONS Census 21 figures)
3.2 Table 1 below shows Wolverley & Cookley population broken down and shown as a percentage as well as a comparison against local and national trends.
Table 1
|
Age Groups |
Wolverley & Cookley (%) |
Wyre Forest (%) |
England (%) |
|---|---|---|---|
|
14 & under |
13.4 |
15.7 |
17.2 |
|
15-64 |
56.4 |
59.1 |
63.5 |
|
65+ |
30.2 |
25.2 |
19.3 |
3.3 Wolverley & Cookley has a lower percentage of all age groups under 64 in comparison to the district and national figures and a higher population of 65+ year olds in comparison to the district and national figures.
3.4 Table 2 below shows the comparison of the economic activity across the parish against local and national trends.
Table 2
|
Economic Activity |
Wolverley & Cookley (%) |
Wyre Forest (%) |
England (%) |
|---|---|---|---|
|
Economically Active in employment |
51.0 |
54.1 |
57.4 |
|
Economically active unemployed |
2.5 |
2.9 |
3.5 |
|
Economically inactive |
46.5 |
43.0 |
39.1 |
3.5 Wolverley & Cookley has a lower percentage of residents in employment than the district and nationally and has a higher percentage that is economically inactive compared to the district and nationally.
3.6 Table 3 below shows the comparison of the type of dwellings in the parish in comparison with the whole of Wyre Forest and the England average.
Table 3
|
Proportion of dwellings by type |
Wolverley & Cookley (%) |
Wyre Forest (%) |
England (%) |
|---|---|---|---|
|
House or Bungalow |
81.1 |
85.0 |
77.4 |
|
Flat, maisonette or apartment |
9.9 |
12.6 |
22.2 |
|
Caravan |
9.0 |
2.4 |
0.4 |
The table above shows the data collected by the Census to corroborate with the findings in this question, there is a significantly higher number of residents living in a house and/or bungalow compared to flats/apartments and motorhomes?
3.7 Wolverley & Cookley has a large proportion of houses and bungalows and caravans in comparison to national figures and a significantly lower number of flats, maisonettes and apartments compared to nationally.
3.8 Table 4 below shows the tenure types and a comparison.
Table 4
|
Proportion of households by tenure |
Wolverley & Cookley (%) |
Wyre Forest (%) |
England (%) |
|---|---|---|---|
|
Owned Outright |
47.2 |
40.8 |
32.5 |
|
Owned with a mortgage or loan |
27.5 |
29.0 |
29.8 |
|
Social Rented |
16.5 |
14.1 |
17.1 |
|
Private Rented |
8.8 |
16.1 |
20.6 |
Figures for tables 1-4 provided by the 2021 census, ONS Crown Copyright
3.9 The amount of people owning outright in Wolverley & Cookey is higher than the district and national figures. The parish also has a lower percentage of residents who are renting privately compared to the Wyre Forest and national percentages.
4. Housing information
4.1 The number of people on housing registers for affordable homes in England has soared, in 2024 there were 1,330,611 households on social housing registers in England which is the highest figure in a decade and an increase of 10% since 2022. Waiting lists have grown substantially over the last 5 years and there are currently 2845 on Wyre Forest’s housing register for social housing.
5. Location and geographic extent of survey
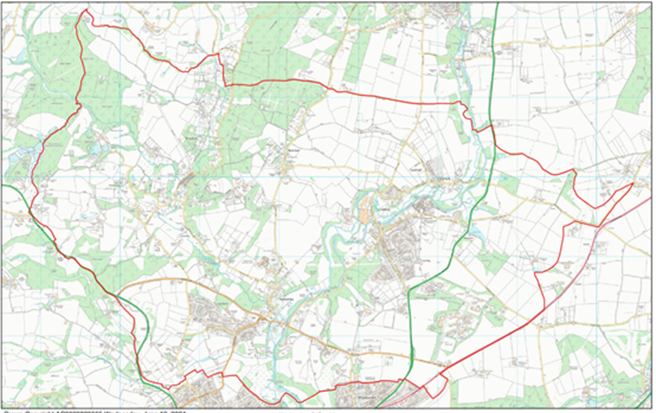
5.1 Wolverley is a village; with nearby Cookley, it forms a civil parish in the Wyre Forest District of Worcestershire. It is 2 miles north of Kidderminster and lies on the River Stour and the Staffordshire and Worcestershire Canal. Its current population is 4650 (ONS Census 2021).
A map of Wolverley and Cookley Parish
6. Methodology
6.1 Wyre Forest District Council conducted the survey to establish the housing requirements for Wolverley & Cookley over the next 10 years. The survey ran for 7 weeks commencing on the 21stOctober 2024 and ended on 6th December 2024.
6.2 All households in Wolverley & Cookley parish received a letter inviting them to complete the questionnaire online, or to contact Wyre Forest District Council directly to request a paper copy in the post. Households were also invited to attend any one of the 4 drop-in sessions that had been arranged in both Wolverley and Cookley where they could get further information regarding the survey and complete the questionnaire, 2790 letters were posted to households who already live in the parish.
6.3 A further 286 letters were sent to applicants on Wyre Forest District Council’s housing waiting list, Home Choice Plus, who had indicated a preference to live in Wolverley & Cookley and had a local connection to the parish
6.4 The aim of the survey is to establish:
- The mix of housing need in the parish.
- The type of connection the household had with the town
- The maximum price range the household could afford, if looking to buy a property
- The maximum monthly rent the household could afford, if looking to move from existing property
- The tenure type (open market, subsidized, social rented or shared ownership)
- The size of the property and need by population (families, single people or older households)
6.5 The survey also gathered information from households that are likely to be subject to change in the next 5 -10 years, for example children looking to move out of the current family home but stay within the town, this was open to anyone who had moved out of the town and was looking to move back into the area.
7. Responses
7.1 A total of 3076 letters were distributed, and 243 responses were received, giving a return rate of 7.9% It should be noted that generally only those people who have a housing need or are interested in a local needs development and parish life are likely to respond and so this is considered a statistically valid response rate.
7.2 Of the 243 responses received, the majority of people currently live within the parish (87%). The average length of time that respondents have lived in the parish is 8 years.
8.Results from the questionnaire
Section 1: Current Accommodation
This section of the survey asked householders about their current accommodation and if they have/are working in the parish. It also asked if they have family in the parish and any other strong local connections.
Q1. Do you currently live…?
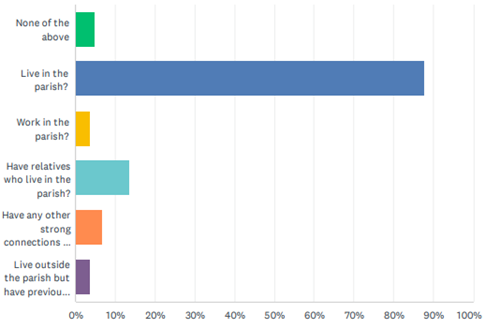
Figure 1 Do you currently...?
1.1 In total 243 respondents answered this question; it should be noted that respondents can give multiple answers to this question. The survey found that 88% (212) selected that they live in the parish, 14% (33) have relatives living in Wolverley & Cookley ,7% (16) having a strong local connection to the parish, 4% (9) work in Wolverley & Cookley, and 4% (9) indicated they had lived in Wolverley & Cookley before.
1.2 The average length of time respondents have lived in the parish is 8 years, with answers ranging from as little as one year or less increasing to as many as 26 years.
1.3 Of the 9 respondents indicated that they work in Wolverley & Cookley, the average length of time working was 7.5 years, ranging from 4 to 30 years.
1.4 There were 33 respondents who advised that they have relatives in Wolverley & Cookley, the average length of time they resided in the parish was 11 years, ranging from 2 years to 30+ years.
1.5 A total of 9 respondents answered that they had previously lived in Wolverley & Cookley and 6 of these 9 were looking to return.
1.6 We received 67 respondents who indicated a strong local connection, with various reasons given varied from working in the parish, family connections and children attending and have attended the local school. (16 from Q1)
Q2. Including yourself, how many people currently live in your home?
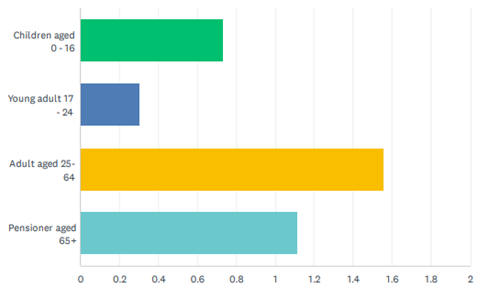
Figure 2 - Including yourself, how many people are there in your household?
2.1 Out of the 173 people who responded to this question, the household make up identified 340 adults and 61 children, giving a simple average of 2 adults and 2 children per household, of the 173 responses, 48 stated they do not have any children living at home.
Q3. What type of property do you currently live in?
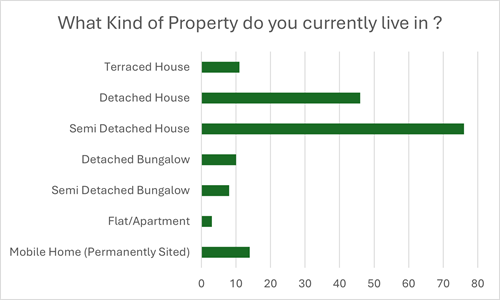
Figure 3 – What kind of property do you live in?
3.1 Of the 173 who responded to this question most households currently live in a semi-detached house 44% (76) followed by a detached house 27% (46), mobile home 8% (14) , semi-detached bungalow 5% (8), terraced house 6% (11), detached bungalow 6% (11), Flat/Apartment 2% (3) ,the respondents who answered with ‘other’ (5) 3%, specified mobile home, barn conversion, or flat.
Q4. How many bedrooms does your home have?
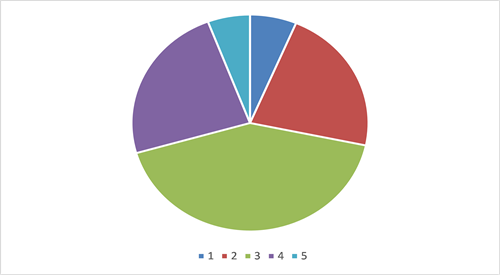
Figure 4 – How many bedrooms does your home have
4.1 There were 173 respondents who answered this question, analysis of the answers shows that 22% (38) have two bedrooms, 42% (73) have three bedrooms, 24% (41) have four-bedroom properties, 6% (10) with five bedrooms and one bedroom 6% (11) being the least common.
4.2 Census data (table 5) show us that 39% of homes in Wolverley & Cookley are 3-bedroom properties, thus supporting the results collected above. The Census data also shows us that 28% are 2-bedroom properties and 21% are 4-bedroom properties. The data above shows that there was a higher percentage of people entering the survey in 3-bedroom properties than 4-bedroom properties.
Table 5
|
Property type |
Wolverley & Cookley (%) |
Wyre Forest (%) |
England (%) |
|---|---|---|---|
|
1 Bedroom |
12% |
10% |
12% |
|
2 Bedroom |
28% |
25% |
27% |
|
3 Bedroom |
39% |
46% |
40% |
|
4 or more Bedrooms |
21% |
19% |
21% |
Q5. Is your home…?
5.1 This question looked at the tenure of the respondent’s current property. In total 173 households answered the question with the majority being owner occupier either owned outright 63% (109) or with a mortgage 22% (39), the census 2021 data mirrored this outcome with Social Rent 6% (11) and Private Rent 5% (9) being lower than national average.
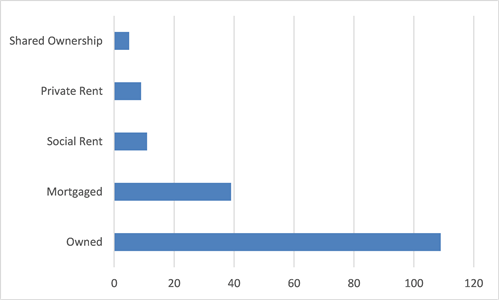
Figure 5 – Tenure of property
Q6. Has anyone from your family moved away from Wolverley & Cookley Parish in the last 5 years?
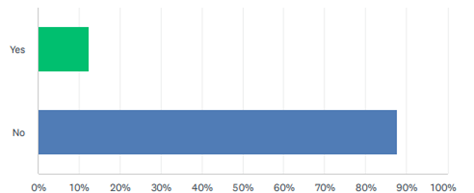
Figure 6 - Has anyone from your family moved away from Wolverley & Cookley in the last 5 years?
6.1 Out of the 178 who answered this question, 88% (156) stated ‘No’ a family member had not previously moved out of Wolverley & Cookley and 12% (22) said ‘Yes’ family members have moved out of their house, the graph below outlines the breakdown of reasons why.
Q7. Details of their reason for leaving
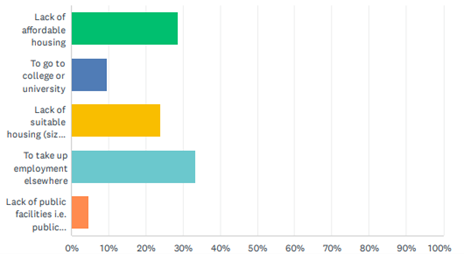
Figure 7 -Details of household members' reasons for leaving
7.1 Out of the 22 respondents stating ‘Yes’ a family member had moved out of Wolverley & Cookley, 21 specified reasons such as to take up employment elsewhere 33% (7), and lack of affordable housing 29% (6), with lack of suitable housing being the lowest response.
Section 2: Affordable Housing
This section asked the respondents to give us their views whether they believed there was adequate affordable housing and facilities within the parish.
Q8. Do you feel that the parish has a suitable range of housing for the current community and the people who would like to live there?
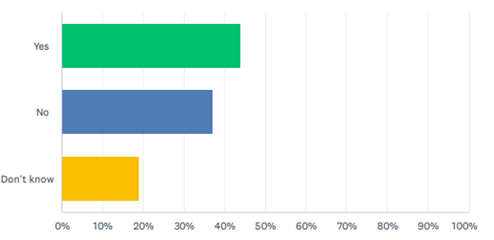
Figure 8 - Do you feel that the town has a suitable range of housing for the current community and the people who would like to live there?
8.1 We received 173 responses to this question with 44% (76) agreeing there is a suitable range of housing for the current community and 37% (64) specifying ‘No’ there is not a suitable range of housing and 19% (33) specifying ‘don’t know’.
8.2 As indicated above 44% agreed there was a suitable range of housing within the parish, with 37% felt the parish does not have a suitable range of housing for their current community raising affordability as a barrier as property prices within the parish are higher than the national average. Please see below examples of other responses.
- Needs more social housing
- Not enough bungalows or apartments
- More starter homes needed
- It appears that there is little to rent in Cookley
- Lots of new houses being built
- Good mix of affordable housing and housing to aspire to
- With people living longer more housing for the elderly would be a good idea
- People born and raised in the parish don’t get a chance to live in the parish they love and know
- House prices and rents continue to rise and are too high, this is pricing people out of the village
Q9. Do you feel that the parish has adequate facilities e.g., shop/public transport for the current community and the people who would like to live there?
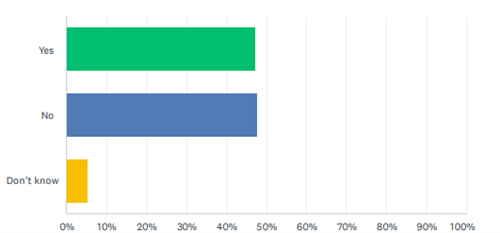
Figure 9 - Do you feel that the parish has adequate facilities e.g., shop/public transport for the current community and the people who would like to live there?
9.1 We received 173 responses regarding the current facilities in the parish, 47% (82) felt there were already adequate facilities and 48% (82) felt there was not, and a further 5% (9) were unsure.
9.2 We asked respondents to expand on the reasons for their answers. The most common answer was that Wolverley & Cookley has inadequate transport links and public transport infrastructure needed. Public transport was reported as the main issue with local facilities and amenities for residents also requiring improvement with residents reporting having to travel out of area to access suitable facilities.
9.3 Below are some comments that we received.
- Lack of public transport
- No post office/pharmacy
- An adequate bus route which is rarely used anyway
- Both have a small number of shops, bus services that are ok
- Medical facilities can be difficult to access
- Travel by car is bad for the environment and getting very expensive. Better local centres will reduce travel, and more public transport will be better for the environment
- At present it is adequate but if more houses are built then obviously, we will need more services
Q10. Would you support a development of new affordable housing for rent/shared ownership within your parish for people with a local connection?
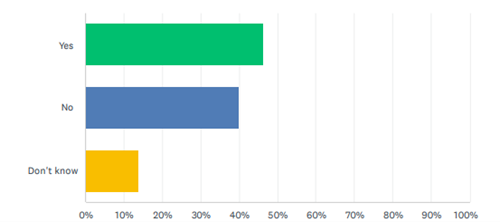
Figure 10 - Would you support a development of new affordable housing for rent/shared ownership within your town for people with a local connection?
10.1 We received 173 responses to this question with 46% (80) supporting the development of new affordable housing in the parish and 40% (69) not supporting the development, 14% (24) did not express a preference.
10.2 There were 91 comments received, here are some examples below.
- Because I moved here for the access to the green belt, we do no need anymore houses spoiling this element of our village
- Nearby existing and proposed recent new housing developments already in progress
- Lea Castle hospital development should be enough
- Some kids who were born here would like to come back to be close to there parents
- I feel this would be very important, especially for someone like me and my partner who need to stay around family
- Only if more GP’s, shops, public transport etc
- Depends on if there is a demand in the parish, if there is then I would support it
- Good to have a variety of housing
Q11.Are any of your household registered with Wyre Forest District Council on the Home Choice Plus Housing Register for either social housing or shared ownership housing?
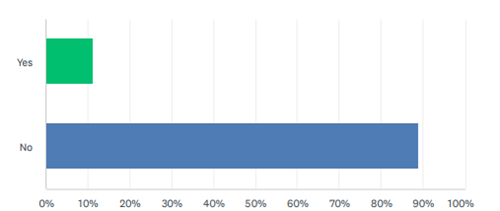
Figure 11 - Are any of your household registered with Wyre Forest District Council on the home Choice Plus Housing Register for either social housing or shared ownership housing?
11.1 We received 173 responses to this question with 89% (154) stating no and 11% (19) stating yes.
Section 3: Alternative Accommodation
This section of the survey asked the householders if they were likely to move home now or within the next 10 years, if they indicated that they would be looking for alternative accommodation, then they were asked further questions about the type of property they would prefer to move into, the tenure type and the affordability. The responses to these questions are used to inform future housing needs in Wolverley & Cookley.
Q12 Are you looking to move?
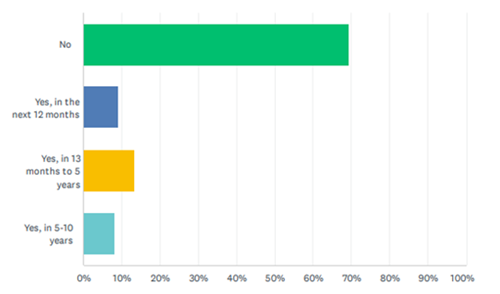
Figure 12 – Are you looking to move?
12.1 Out of the 173 respondents 70% (120) answered ‘No’ they were not looking for alternative accommodation and 31% (53) answered ‘Yes’.
12.2 The tables in appendix one shows the respondents current living arrangements and the size and tenure of the alternative accommodation they will need in the next 12 months, the next 13 months to 5 years and 5 to 10 years.
Q13 When would you expect to move? If looking for alternative accommodation
13.1 In total 53 respondents indicated they would require a home in Wolverley & Cookley within the next 10 years.
13.2 Of the 53, 30% (16) who responded advised they would be looking to move within the next 12 months, 43% (23) will be looking to move in the next 13 months to five years and 26% (14) within the next 5 to 10 years.
Q14 What type of accommodation would you prefer?
14.1 We received 61 responses in total across the specified timescales, 18 responses to move within 12 months, 25 to move in 13months – 5 years and 18 responses of those wishing to move within the next 5-10 years. Of that 61, respondents indicated the type of accommodation they would prefer with the majority 51% (27) looking for a detached property, 25% (13) of those specifically a detached bungalow. Both Semi-Detached and Detached Houses were also of a similar preference with 23% (12) wanting a Semi-Detached House and 26% (14) specifying a Detached House. There was little demand for flats, apartments and terraced house types within the survey with only 9% (5) responses specifying this property type.
Q15 How many bedrooms would you require?
15.1 The highest bedroom need was 3 bedrooms 45% (24), and 2 bedrooms 43% (23) with the next highest demand of 11% (6) 4 bedrooms, demand for 1 bedroom accommodation within the area was low at 9% (5) and similarly with larger properties with only 6% (3) respondents indicating a need for a property with 5 or more bedrooms.
Q16 Why do you need to move?
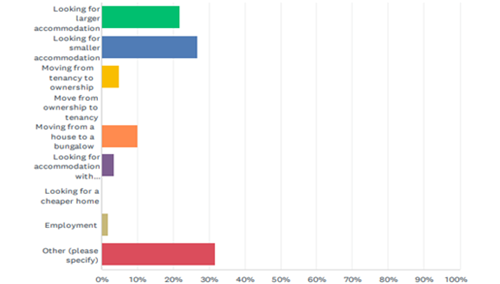
Figure 16- Why does your household need to move?
16.1 Out of the 61 respondents, there were 27% (16) looking for smaller accommodation with 22% (13) were looking for larger accommodation, of those 10% (6) were looking to move from a house to a bungalow, 5% (3) to move from tenancy to ownership. Aids & Adaptations was another preference with (2) 3% needing to move for this reason along with (1) 1% indicating employment. A further reason (20) 32% selected ‘Other’ indicating reasons such as:
- Family of 3 about to be 4 with my parents in a caravan in the garden
- Driveway/parking needed and a smaller garden
- Upgrade from Mobile Home – having to move off site yearly causes issues
- Move closer to family
Q17. Would you expect to be …?
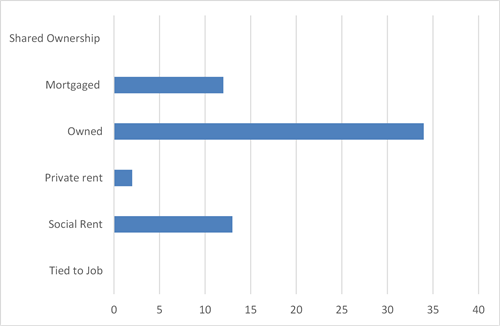
Figure 17- Would you expect to be…?
17.1 Out of the 61 respondents, most expect to be owner occupiers 75% (46), 21% (13) indicating they would like to rent from a housing association with, 3% (2) wanting private rental.
17.2 When questioned on how much the householder would be able to afford if renting an alternative property, 55 respondents answered this question with 21% of those indicating they could afford up to £500 per calendar month, 9% between £801 to £900 per calendar month and 18% indicated they could afford more than £901 per calendar month. Current rental values in the area are in the range of £694-£909 for a flat in Wolverley whilst in Cookley the average is around £663 (Rightmove Oct 2025). Therefore, the average price range for renting in Wolverley & Cookley is £755 per calendar month, based on this average only 27% would be able to afford this price range, indicating a need for more affordable rented accommodation.
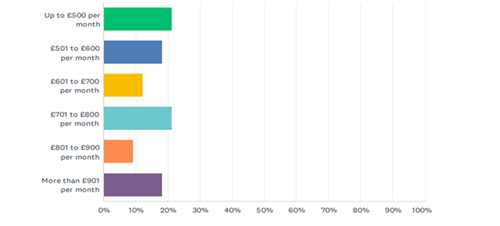
Figure 18.1- How much do you think you would be able to afford if renting a new property.
17.3 When questioned on how much the householder would be able to afford if purchasing an alternative property, a total of 51 respondents answered this question with 22% (11), indicating they could afford between £250,001 to £300,000, with a further 16% (8) indicating that they could afford over £500,001. In the last 12 months the average sale price in Wolverley was £572,111 & Cookley was £291,545 (Rightmove October 2025). Based on the responses received this indicates that 18% (9) could afford the average sale price and shows there is inadequate owner occupier accommodation available within the parish, also seeing a decrease in historical sold prices over the last year.
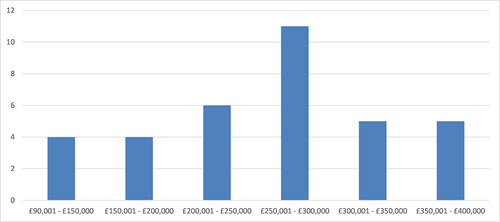
Figure 18.2- How much do you think you would be able to afford if purchasing a new property.
Section 4: Additional Households
This section asked the respondents if any current members of their household would be looking to move within the next 10 years to create a new separate household within the parish. If they indicated that there would be members looking to create a new household, then we asked them for more information including the property type that they would prefer to move into, the tenure type and the affordability.
Q18. Is anyone looking to move out of your home into a new household within the parish in the next 10 years?
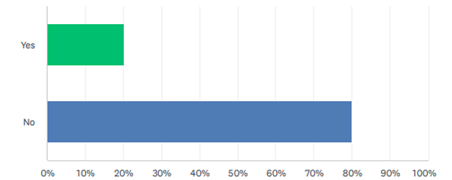
Figure 18. Is anyone looking to move out of your home into a new household within the parish in the next 10 years?
18.1 A total of 36 (20%) respondents indicated that members of their current household will be looking for an additional home(s) within the next 10 years, 144 (80%) indicated ‘No’.
18.2 How many current household members wish to form a household inside the parish within the next 10 years?
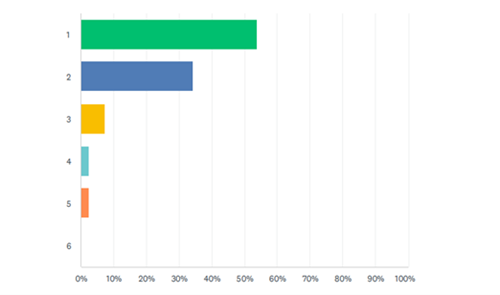
Figure 18.2 - How many current household members wish to form a new household inside the town within the next 10 years?
18.3 Of the 41 respondents who answered the question the majority needed one additional home 54% (22), followed by 34% (14) requiring two additional homes. This question gave the respondent four opportunities to indicate the number of additional households required, allowing the survey to consider multiple additional households from one original household. Therefore, of the 41 respondents who did answer, the survey shows that 44 additional homes are required.
Q19. When would the new householder, expect to move?
19.1 Of the 30 respondents that said yes, 45 family members indicated they would require a home in Wolverley & Cookley within the next 10 years.
19.2 When is household likely to be created?
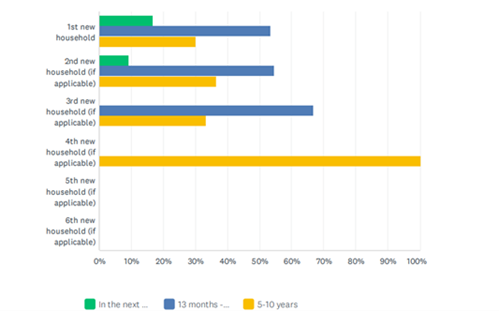
Figure. – When is the household likely to be created?
19.2 When questioned 8% (6) of households who responded advised they would be looking to move within the next 12 months, 54% (24) will be looking to move in the next 13 months to five years and 34% (15) within the next five to 10 years.
Q20. What type of accommodation would you prefer?
20.1 Of the 41 respondents, 44 (multiple households could answer) indicated the type of accommodation they would prefer with 37% (15) looking for a semi-detached house, 22% (9) a detached house and 32% (13) specifying bungalow, with 10% (4) of those responses specifying a detached bungalow.
Q21. How many bedrooms would you require?
21.1 We received 53% (21) responses who required a 2-bedroom property, 38% (15), responses required 3-bedroom properties, with a further 10% (4) responses requiring a 5+ bedroom property.
Q22. Why will the new household be created?
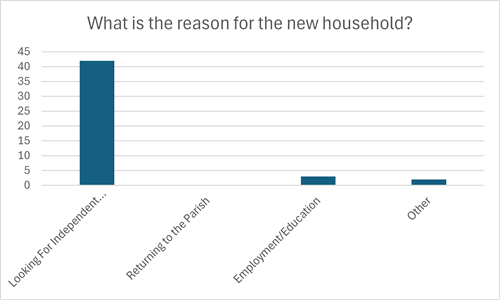
Figure 22 – Why will the new household be created?
22.1 Out of the 45 responses, 88% (42) were looking for independent accommodation, it was clear that 6% (3) were looking to move into the parish for employment/education, with 6% (3) of responses indicating other reasons such as ‘looking for a property without stairs’, ‘seeking elderly accommodation’ - put note if necessary to confirm about being able to answer more than once ……
Q23 What tenure type would be preferred for the new household…?
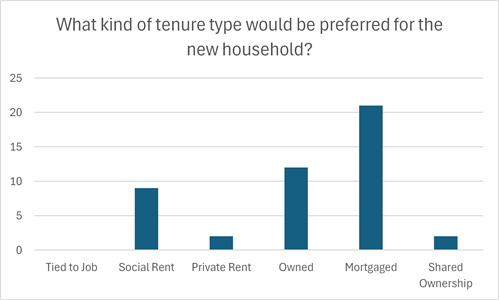
Figure 23 – What kind of tenure would be preferred for the new household…?
23.1 Out of the 49 answers 72% (33) expect to be ‘owner occupiers’, whilst 20% (9) indicated they would want to rent from a housing association, with 4% (2) with a preference to rent privately and a further 4% (2) would consider shared ownership. ‘Other’ was selected by (3) 7% specifying ‘barn conversion, warden-controlled accommodation and one answer did not specify preferred tenure type.
23.2 When questioned on how much the new householder would be able to afford if renting an additional property (3) 7% indicated they could afford between £501 to £600 per calendar month and (10) 22% indicated they could afford up to £500 per calendar month. Of the 45 answers (6) 13% indicated that they could afford between £801-£900 per calendar month (3) 7% advised they could afford over £900 per calendar month. Based on the average price of renting in Wolverley & Cookley (£1000pcm as of March 2025), only a possible (3) 7% (?) could afford to rent on the current open market when looking for additional properties.
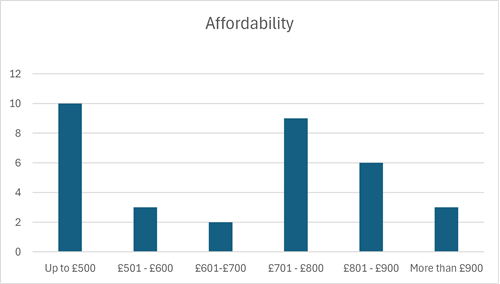
Figure 23.2 – How much would you be able to afford if renting?
23.3 When questioned on how much the new householder would be able to afford if purchasing an additional property, 30 respondents answered this question (3) 6% indicating they could afford between £250,001 to £300,000, with (11) 24% indicated that they could afford between £200,001 - £250,000, (7) 15% indicated they could afford between £90,001 – £150,000. A total of (3) 6% indicated affordability of a property between £450,001 - £500,000 indicating a small percentage of respondents would be able to meet their housing needs by purchasing in this area. A further (3) 6% indicated they would be interested in shared ownership.
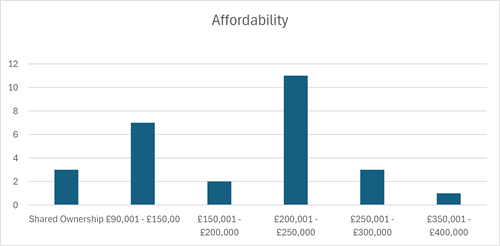
Figure 23.3 – How much would you be able to afford if purchasing an additional property?
23.4 Research shows properties in Wolverley had an average sale price of £572,111, over the last year (Rightmove.co.uk Oct 2025) with the majority of properties sold being ‘detached’. Semi-detached properties sold for an average of £402,500 with flats averaging £285,000, no data was available for sales of terraced properties within the Wolverley area. From the answers given only 6% who are looking would be able to purchase a property based on current availability indicating low-cost home ownership options are needed for additional accommodation in this area.
Section 5: People looking to move back into Wolverley & Cookley
This section asked the respondents if they had a local connection such as work, relatives or had previously lived in Wolverley & Cookley and were looking to move back into Wolverley & Cookley and what was their preferred property type, bedroom need and tenure.
Q24. Are you looking at moving into Wolverley & Cookley in the next 10 years?
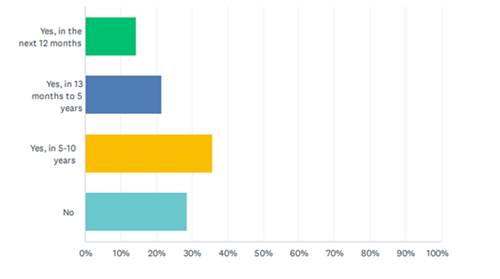
Figure Are you looking at moving into Wolverley and Cookley in the next 10 years.
24.1 We received 14 responses to this question with a total of 10 respondents who indicated they would like to move into Wolverley & Cookley within the next 10 years.
24.2 Additional homes needed in the next 12 months for people returning to Wolverley & Cookley parish.
|
Preferred Property Type |
Preferred Property Size |
Preferred Tenure Type |
|---|---|---|
|
Semi-Detached House |
3 Beds |
Social Rent |
|
Other |
1 Beds |
Social Rent |
24.3 Additional properties needed in the next 13 months to 5 years for people Wolverley & Cookley parish.
|
Preferred Property Type |
Preferred Property Size |
Preferred Tenure Type |
|---|---|---|
|
Detached Bungalow or Semi-Detached House |
3 Beds |
Owned |
|
Detached House |
3 beds |
Owned |
|
Did not answer |
Did not answer |
Did not answer |
24.4 Additional properties needed in the next 5 to 10 years for people returning to Wolverley & Cookley parish.
|
Preferred Property Type |
Preferred Property Size |
Preferred Tenure Type |
|---|---|---|
|
Detached House |
5+ Beds |
Owned |
|
Detached House |
5+ Beds |
Owned |
|
Semi-Detached Bungalow |
3 Beds |
Social Rent |
|
Semi-Detached House |
3 Beds |
Owned |
|
Did not answer |
Did not answer |
Did not answer |
Q25. Are you looking to move into Wolverley & Cookley parish in the next 10 years?
25.1 10 respondents indicated they would require a home in Wolverley & Cookley parish within the next 10 years.
25.2 Of these 20% of households who responded advised they would be looking to move within the next 12 months, 30% will be looking to move in the next 13 months to five years and 50% within the next 5 to 10 years.
Q26. What type of accommodation would you prefer?
26.1 Of the 10 respondents 60% would prefer a house, 10% required a bungalow, 10% selected other and 20% did not answer.
Q27. How many bedrooms would you require?
27.1 The highest bedroom requirement was for three bedrooms at 50% followed by 5+ bedroom properties 20%, with the least demand of one bedroom 10%, a further 20% did not answer
Q28. Why does your household need to move?
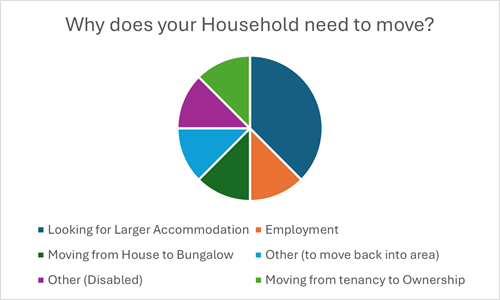
Figure. Why does your household need to move?
28.1 Out of the 10 respondents who answered this question, 30% were looking for larger accommodation and 10% were looking to move from a tenancy to ownership 10% (1) from a house to a bungalow. With 10% moving due to employment and 20% ‘Other’ for example specifying a need to move back into the area and due to disability.
Q29. Would you expect to be…?
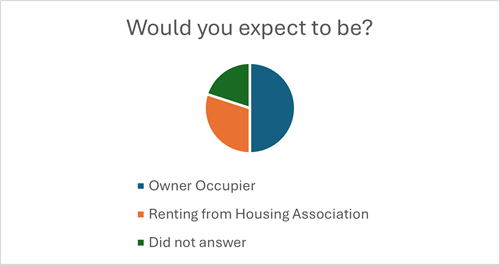
Figure 29 – Would you expect to be…?
29.1 Out of the 10 respondents who answered this question, most expect to be owner occupiers 50%, 30%were expecting to be renting from a housing association, and 20%did not answer.
29.2 When questioned on how much the householder would be able to afford if renting either socially or privately in Wolverley & Cookley parish, ) 10% indicated they could afford £701- £800 per month, whilst 20% could afford between £801 - £900, 70% did not answer It should be noted that some respondents answered both renting and buying affordability questions and did not state the type of tenure they would be looking for. At the time of writing this report, there were not any available properties for private rental in Wolverley & Cookley parish, this means renting on the open market would likely not be accessible to those who specified this as their preferred tenure option.
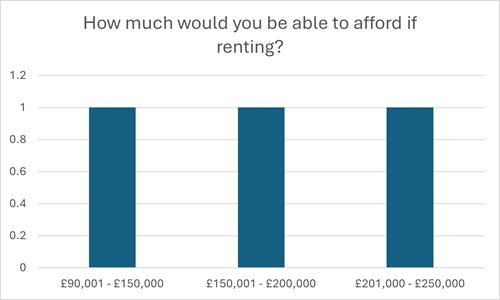
Figure 29.2 – How much would you be able to afford if renting?
29.3 When questioned on how much the householder would be able to afford if purchasing accommodation, 22% (2) indicated they could afford over £500,000. There was then an equal split over pricing brackets £90-001, £150,000 - £200,000, £200,001 - £250,000, and £250,001 - £300,000. With the average sale price on the open market currently in Wolverley at £572,111 & Cookley at £291,545 (Rightmove October 2025). (this would indicate only a possible (2) % could afford properties on the open market for people returning to the area.
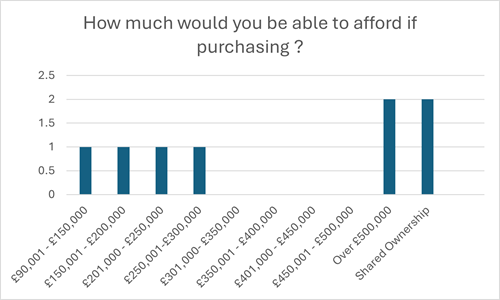
Figure 29.3 – How much would you be able to afford if purchasing?
29.4 Out of 10 respondents, 50% specified they would like to purchase a property, with 30% looking to rent and a further 20% did not answer.
Section 6. Summary of homes required in the parish
30.1 Further research into the responses received has shown that if we cross match the homes that in theory will be vacated to those that will be required for alternative, additional or people moving back to Wolverley & Cookley with a local connection, the result will be the following housing need:
| Owner occupier | Shared Ownership | Social Rent | Private Rent | Other | Unknown | Total | |||||||||||||||||||||||||||||||||||||||||||
|---|---|---|---|---|---|---|---|---|---|---|---|---|---|---|---|---|---|---|---|---|---|---|---|---|---|---|---|---|---|---|---|---|---|---|---|---|---|---|---|---|---|---|---|---|---|---|---|---|---|
| Property Type | 1 Bed | 2 Bed | 3 Bed | 4 Bed | 5 Bed | Supported accommodation | Other | Unknown | 1 Bed | 2 Bed | 3 Bed | 4 Bed | 5 Bed | Supported accommodation | Other | Unknown | 1 Bed | 2 Bed | 3 Bed | 4 Bed | 5 Bed | Supported accommodation | Other | Unknown | 1 Bed | 2 Bed | 3 Bed | 4 Bed | 5 Bed | Supported accommodation | Other | Unknown | 1 Bed | 2 Bed | 3 Bed | 4 Bed | 5 Bed | Supported accommodation | Other | Unknown | 1 Bed | 2 Bed | 3 Bed | 4 Bed | 5 Bed | Supported accommodation | Other | Unknown | |
| Semi-detached bungalow | 0 | 2 | 0 | 0 | 0 | 0 | 0 | 0 | 0 | 0 | 0 | 0 | 0 | 0 | 0 | 0 | 1 | 2 | 0 | 0 | 0 | 0 | 0 | 0 | 0 | 0 | 0 | 0 | 0 | 0 | 0 | 0 | 0 | 0 | 0 | 0 | 0 | 0 | 0 | 0 | 0 | 0 | 0 | 0 | 0 | 0 | 0 | 0 | 5 |
| Detached bungalow | 0 | 1 | 0 | 0 | 0 | 0 | 0 | 0 | 0 | 0 | 0 | 0 | 0 | 0 | 0 | 0 | 0 | 0 | 0 | 0 | 0 | 0 | 0 | 0 | 0 | 0 | 0 | 0 | 0 | 0 | 0 | 0 | 0 | 0 | 0 | 0 | 0 | 0 | 0 | 0 | 0 | 0 | 0 | 0 | 0 | 0 | 0 | 0 | 1 |
| Terraced house | 0 | 0 | 0 | 0 | 0 | 0 | 0 | 0 | 0 | 0 | 0 | 0 | 0 | 0 | 0 | 0 | 0 | 0 | 2 | 0 | 0 | 0 | 0 | 0 | 0 | 0 | 0 | 0 | 0 | 0 | 0 | 0 | 0 | 0 | 0 | 0 | 0 | 0 | 0 | 0 | 0 | 0 | 0 | 0 | 0 | 0 | 0 | 0 | 2 |
| Semi-detached house | 0 | 3 | 0 | 0 | 0 | 0 | 0 | 0 | 0 | 0 | 3 | 0 | 0 | 0 | 0 | 0 | 0 | 1 | 0 | 1 | 0 | 0 | 0 | 0 | 0 | 0 | 0 | 0 | 0 | 0 | 0 | 0 | 0 | 0 | 0 | 0 | 0 | 0 | 0 | 0 | 0 | 0 | 0 | 0 | 0 | 0 | 0 | 0 | 8 |
| Detached house | 0 | 0 | 0 | 0 | 0 | 0 | 0 | 0 | 0 | 0 | 0 | 0 | 0 | 0 | 0 | 0 | 0 | 0 | 0 | 0 | 0 | 0 | 0 | 0 | 0 | 0 | 0 | 0 | 0 | 0 | 0 | 0 | 0 | 0 | 0 | 0 | 0 | 0 | 0 | 0 | 0 | 0 | 0 | 0 | 0 | 0 | 0 | 0 | 0 |
| Flat/apartment | 0 | 1 | 0 | 0 | 0 | 0 | 0 | 0 | 0 | 0 | 0 | 0 | 0 | 0 | 0 | 0 | 0 | 0 | 0 | 0 | 0 | 0 | 0 | 0 | 0 | 0 | 0 | 0 | 0 | 0 | 0 | 0 | 0 | 0 | 0 | 0 | 0 | 0 | 0 | 0 | 0 | 0 | 0 | 0 | 0 | 0 | 0 | 0 | 1 |
| Mobile home (permanently sited) | 0 | 0 | 0 | 0 | 0 | 0 | 0 | 0 | 0 | 0 | 0 | 0 | 0 | 0 | 0 | 0 | 0 | 0 | 0 | 0 | 0 | 0 | 0 | 0 | 0 | 0 | 0 | 0 | 0 | 0 | 0 | 0 | 0 | 0 | 0 | 0 | 0 | 0 | 0 | 0 | 0 | 0 | 0 | 0 | 0 | 0 | 0 | 0 | 0 |
| Other (please specify) | 0 | 1 | 0 | 0 | 0 | 0 | 0 | 0 | 0 | 0 | 0 | 0 | 0 | 0 | 0 | 0 | 0 | 0 | 0 | 0 | 0 | 0 | 0 | 0 | 0 | 0 | 0 | 0 | 0 | 0 | 0 | 0 | 0 | 0 | 0 | 0 | 0 | 0 | 0 | 0 | 0 | 0 | 0 | 0 | 0 | 0 | 0 | 0 | 1 |
| No Details | 0 | 0 | 0 | 0 | 0 | 0 | 0 | 0 | 0 | 0 | 0 | 0 | 0 | 0 | 0 | 0 | 0 | 0 | 0 | 0 | 0 | 0 | 0 | 0 | 0 | 0 | 0 | 0 | 0 | 0 | 0 | 0 | 0 | 0 | 0 | 0 | 0 | 0 | 0 | 0 | 0 | 0 | 0 | 0 | 0 | 0 | 0 | 0 | 0 |
| Total | 0 | 8 | 0 | 0 | 0 | 0 | 0 | 0 | 0 | 0 | 3 | 0 | 0 | 0 | 0 | 0 | 1 | 3 | 2 | 1 | 0 | 0 | 0 | 0 | 0 | 0 | 0 | 0 | 0 | 0 | 0 | 0 | 0 | 0 | 0 | 0 | 0 | 0 | 0 | 0 | 0 | 0 | 0 | 0 | 0 | 0 | 0 | 0 | 18 |
Figure 30.2 – Breakdown of housing need in the next 12 months
30.2 Therefore, the demand in Wolverley & Cookley for the next 12 months is 18 homes.
30.3 The largest need regarding the number of bedrooms required by a large proportion is 2 bedrooms with 11 (61%) of the demand, followed by 3 bedrooms with 8 (44%) with the lowest being 1 bedroom along with 4 or more bedrooms requiring only 1 (5%) in the next 12 months.
30.4 The highest need regarding property types is semi-detached house with 8 (44%) followed by semi-detached bungalow with 5 (28%) in the next 12 months.
30.5 The highest need regarding tenure type is owner occupier with 8 (44%) followed by social rent 7 (39%) and shared ownership at 3 (17%).
| Owner occupier | Shared Ownership | Social Rent | Private Rent | Other | Unknown | Total | |||||||||||||||||||||||||||||||||||||||||||
|---|---|---|---|---|---|---|---|---|---|---|---|---|---|---|---|---|---|---|---|---|---|---|---|---|---|---|---|---|---|---|---|---|---|---|---|---|---|---|---|---|---|---|---|---|---|---|---|---|---|
| Property Type | 1 Bed | 2 Bed | 3 Bed | 4 Bed | 5 Bed | Supported accommodation | Other | Unknown | 1 Bed | 2 Bed | 3 Bed | 4 Bed | 5 Bed | Supported accommodation | Other | Unknown | 1 Bed | 2 Bed | 3 Bed | 4 Bed | 5 Bed | Supported accommodation | Other | Unknown | 1 Bed | 2 Bed | 3 Bed | 4 Bed | 5 Bed | Supported accommodation | Other | Unknown | 1 Bed | 2 Bed | 3 Bed | 4 Bed | 5 Bed | Supported accommodation | Other | Unknown | 1 Bed | 2 Bed | 3 Bed | 4 Bed | 5 Bed | Supported accommodation | Other | Unknown | |
| Semi-detached bungalow | 1 | 4 | 3 | 0 | 0 | 0 | 0 | 0 | 0 | 0 | 0 | 0 | 0 | 0 | 0 | 0 | 0 | 4 | 0 | 0 | 0 | 0 | 0 | 0 | 0 | 0 | 0 | 0 | 0 | 0 | 0 | 0 | 0 | 0 | 0 | 0 | 0 | 0 | 0 | 0 | 0 | 0 | 0 | 0 | 0 | 0 | 0 | 0 | 12 |
| Detached bungalow | 0 | 4 | 0 | 0 | 0 | 0 | 0 | 0 | 0 | 1 | 0 | 0 | 0 | 0 | 0 | 0 | 2 | 0 | 0 | 0 | 0 | 0 | 0 | 0 | 0 | 0 | 0 | 0 | 0 | 0 | 0 | 0 | 0 | 0 | 0 | 0 | 0 | 0 | 0 | 0 | 0 | 0 | 0 | 0 | 0 | 0 | 0 | 0 | 6 |
| Terraced house | 1 | 2 | 0 | 0 | 0 | 0 | 0 | 0 | 0 | 0 | 0 | 0 | 0 | 0 | 0 | 0 | 0 | 0 | 0 | 0 | 0 | 0 | 0 | 0 | 0 | 0 | 0 | 0 | 0 | 0 | 0 | 0 | 0 | 0 | 0 | 0 | 0 | 0 | 0 | 0 | 0 | 0 | 0 | 0 | 0 | 0 | 0 | 0 | 4 |
| Semi-detached house | 0 | 4 | 0 | 1 | 0 | 0 | 0 | 0 | 0 | 1 | 0 | 0 | 0 | 0 | 0 | 0 | 0 | 0 | 2 | 0 | 0 | 0 | 0 | 0 | 0 | 1 | 0 | 0 | 0 | 0 | 0 | 0 | 0 | 0 | 0 | 0 | 0 | 0 | 0 | 0 | 0 | 0 | 0 | 0 | 0 | 0 | 0 | 0 | 8 |
| Detached house | 0 | 0 | 2 | 0 | 2 | 0 | 0 | 0 | 0 | 0 | 0 | 0 | 0 | 0 | 0 | 0 | 0 | 0 | 0 | 0 | 0 | 0 | 0 | 0 | 0 | 0 | 0 | 0 | 0 | 0 | 0 | 0 | 0 | 0 | 0 | 0 | 0 | 0 | 0 | 0 | 0 | 0 | 0 | 0 | 0 | 0 | 0 | 0 | 5 |
| Flat/apartment | 0 | 0 | 0 | 0 | 0 | 0 | 0 | 0 | 0 | 0 | 0 | 0 | 0 | 0 | 0 | 0 | 0 | 0 | 0 | 0 | 0 | 0 | 0 | 0 | 1 | 0 | 0 | 0 | 0 | 0 | 0 | 0 | 0 | 0 | 0 | 0 | 0 | 0 | 0 | 0 | 0 | 0 | 0 | 0 | 0 | 0 | 0 | 0 | 1 |
| Mobile home (permanently sited) | 0 | 0 | 0 | 0 | 0 | 0 | 0 | 0 | 0 | 0 | 0 | 0 | 0 | 0 | 0 | 0 | 0 | 0 | 0 | 0 | 0 | 0 | 0 | 0 | 0 | 0 | 0 | 0 | 0 | 0 | 0 | 0 | 0 | 0 | 0 | 0 | 0 | 0 | 0 | 0 | 0 | 0 | 0 | 0 | 0 | 0 | 0 | 0 | 0 |
| Other (please specify) | 0 | 0 | 0 | 0 | 0 | 0 | 0 | 0 | 0 | 0 | 0 | 0 | 0 | 0 | 0 | 0 | 0 | 0 | 0 | 0 | 0 | 0 | 0 | 0 | 0 | 0 | 0 | 0 | 0 | 0 | 0 | 0 | 0 | 0 | 0 | 0 | 0 | 0 | 0 | 0 | 0 | 0 | 0 | 0 | 0 | 0 | 0 | 0 | 0 |
| No Details | 0 | 0 | 0 | 0 | 0 | 0 | 0 | 0 | 0 | 0 | 0 | 0 | 0 | 0 | 0 | 0 | 0 | 0 | 0 | 0 | 0 | 0 | 0 | 0 | 0 | 0 | 0 | 0 | 0 | 0 | 0 | 0 | 0 | 0 | 0 | 0 | 0 | 0 | 0 | 0 | 0 | 0 | 0 | 0 | 0 | 0 | 0 | 0 | 0 |
| Total | 2 | 14 | 5 | 1 | 2 | 0 | 0 | 0 | 0 | 2 | 0 | 0 | 0 | 0 | 0 | 0 | 2 | 4 | 2 | 0 | 0 | 0 | 0 | 0 | 1 | 1 | 0 | 0 | 0 | 0 | 0 | 0 | 0 | 0 | 0 | 0 | 0 | 0 | 0 | 0 | 0 | 0 | 0 | 0 | 0 | 0 | 0 | 0 | 36 |
Figure 30.6 – Breakdown of housing need in the next 13 months to 5 years.
30.6 Therefore, the demand in Wolverley & Cookley in the next 13months to 5 years is 36 homes.
30.7 The largest need regarding the number of bedrooms required by a large proportion is 2 bedrooms with 21 (58%) of the demand, followed by 3 bedrooms with 7 (19%) with the lowest response being 1 bedroom with 5 (14%) in the next 13 months to five years.
30.8 The highest need regarding property types is semi-detached bungalow 12 (33%) and semi-detached house 8 (22%) followed by detached bungalow 6 (16%) then detached house with 5 (14%) in the next 13 months to five years. The demand for terraced house 4(11%) followed by flats/apartment (1) 3%
30.9 The highest need regarding tenure type is owner occupier with 24 (67%) followed by social rent at 8 (22%), with shared ownership was and private rented at 2 (6%) in the next 13 months to five years.
| Owner occupier | Shared Ownership | Social Rent | Private Rent | Other | Unknown | Total | |||||||||||||||||||||||||||||||||||||||||||
|---|---|---|---|---|---|---|---|---|---|---|---|---|---|---|---|---|---|---|---|---|---|---|---|---|---|---|---|---|---|---|---|---|---|---|---|---|---|---|---|---|---|---|---|---|---|---|---|---|---|
| Property Type | 1 Bed | 2 Bed | 3 Bed | 4 Bed | 5 Bed | Supported accommodation | Other | Unknown | 1 Bed | 2 Bed | 3 Bed | 4 Bed | 5 Bed | Supported accommodation | Other | Unknown | 1 Bed | 2 Bed | 3 Bed | 4 Bed | 5 Bed | Supported accommodation | Other | Unknown | 1 Bed | 2 Bed | 3 Bed | 4 Bed | 5 Bed | Supported accommodation | Other | Unknown | 1 Bed | 2 Bed | 3 Bed | 4 Bed | 5 Bed | Supported accommodation | Other | Unknown | 1 Bed | 2 Bed | 3 Bed | 4 Bed | 5 Bed | Supported accommodation | Other | Unknown | |
| Semi-detached bungalow | 0 | 3 | 0 | 0 | 0 | 0 | 0 | 0 | 0 | 0 | 0 | 0 | 0 | 0 | 0 | 0 | 0 | 0 | 0 | 0 | 0 | 0 | 0 | 0 | 0 | 0 | 0 | 0 | 0 | 0 | 0 | 0 | 0 | 0 | 0 | 0 | 0 | 0 | 0 | 0 | 0 | 0 | 0 | 0 | 0 | 0 | 0 | 0 | 3 |
| Detached bungalow | 0 | 2 | 3 | 0 | 0 | 0 | 0 | 0 | 0 | 0 | 0 | 0 | 0 | 0 | 0 | 0 | 0 | 0 | 0 | 0 | 0 | 0 | 0 | 0 | 0 | 0 | 0 | 0 | 0 | 0 | 0 | 0 | 0 | 0 | 0 | 0 | 0 | 0 | 0 | 0 | 0 | 0 | 0 | 0 | 0 | 0 | 0 | 0 | 5 |
| Terraced house | 0 | 1 | 0 | 0 | 0 | 0 | 0 | 0 | 0 | 0 | 0 | 0 | 0 | 0 | 0 | 0 | 0 | 0 | 0 | 0 | 0 | 0 | 0 | 0 | 0 | 0 | 0 | 0 | 0 | 0 | 0 | 0 | 0 | 0 | 0 | 0 | 0 | 0 | 0 | 0 | 0 | 0 | 0 | 0 | 0 | 0 | 0 | 0 | 1 |
| Semi-detached house | 0 | 0 | 2 | 0 | 0 | 0 | 0 | 0 | 0 | 0 | 0 | 0 | 0 | 0 | 0 | 0 | 0 | 0 | 1 | 0 | 0 | 0 | 0 | 0 | 0 | 0 | 0 | 0 | 0 | 0 | 0 | 0 | 0 | 0 | 0 | 0 | 0 | 0 | 0 | 0 | 0 | 0 | 0 | 0 | 0 | 0 | 0 | 0 | 3 |
| Detached house | 0 | 1 | 0 | 0 | 0 | 0 | 0 | 0 | 0 | 0 | 0 | 0 | 0 | 0 | 0 | 0 | 0 | 0 | 0 | 0 | 0 | 0 | 0 | 0 | 0 | 0 | 0 | 0 | 0 | 0 | 0 | 0 | 0 | 0 | 0 | 0 | 0 | 0 | 0 | 0 | 0 | 0 | 0 | 0 | 0 | 0 | 0 | 0 | 1 |
| Flat/apartment | 0 | 2 | 0 | 0 | 0 | 0 | 0 | 0 | 0 | 0 | 0 | 0 | 0 | 0 | 0 | 0 | 0 | 0 | 0 | 0 | 0 | 0 | 0 | 0 | 1 | 0 | 0 | 0 | 0 | 0 | 0 | 0 | 0 | 0 | 0 | 0 | 0 | 0 | 0 | 0 | 0 | 0 | 0 | 0 | 0 | 0 | 0 | 0 | 3 |
| Mobile home (permanently sited) | 0 | 0 | 0 | 0 | 0 | 0 | 0 | 0 | 0 | 0 | 0 | 0 | 0 | 0 | 0 | 0 | 0 | 0 | 0 | 0 | 0 | 0 | 0 | 0 | 0 | 0 | 0 | 0 | 0 | 0 | 0 | 0 | 0 | 0 | 0 | 0 | 0 | 0 | 0 | 0 | 0 | 0 | 0 | 0 | 0 | 0 | 0 | 0 | 0 |
| Other (please specify) | 0 | 0 | 0 | 0 | 0 | 0 | 0 | 0 | 0 | 0 | 0 | 0 | 0 | 0 | 0 | 0 | 0 | 0 | 0 | 0 | 0 | 0 | 0 | 0 | 0 | 0 | 0 | 0 | 0 | 0 | 0 | 0 | 0 | 0 | 0 | 0 | 0 | 0 | 0 | 0 | 0 | 0 | 0 | 0 | 0 | 0 | 0 | 0 | 0 |
| No Details | 0 | 0 | 0 | 0 | 0 | 0 | 0 | 0 | 0 | 0 | 0 | 0 | 0 | 0 | 0 | 0 | 0 | 0 | 0 | 0 | 0 | 0 | 0 | 0 | 0 | 0 | 0 | 0 | 0 | 0 | 0 | 0 | 0 | 0 | 0 | 0 | 0 | 0 | 0 | 0 | 0 | 0 | 0 | 0 | 0 | 0 | 0 | 0 | 0 |
| Total | 0 | 9 | 5 | 0 | 0 | 0 | 0 | 0 | 0 | 0 | 0 | 0 | 0 | 0 | 0 | 0 | 0 | 0 | 1 | 0 | 0 | 0 | 0 | 0 | 1 | 0 | 0 | 0 | 0 | 0 | 0 | 0 | 0 | 0 | 0 | 0 | 0 | 0 | 0 | 0 | 0 | 0 | 0 | 0 | 0 | 0 | 0 | 0 | 16 |
Figure 30.10 – Breakdown of housing need in the next next 5 to 10 years.
30.10 Therefore, the demand in Wolverley & Cookley in the next 5 years to 10 years is 16 homes.
30.11 The largest need regarding the number of bedrooms required is 2 bedrooms with 9 (56%) of the demand, followed by 3 bedrooms with 6 (36%) with the lowest being 1 bedroom with 1(6%) in the next five to 10 years.
30.12 The highest need regarding property types is detached bungalow 5 (31%), with semi-detached bungalow and semi-detached house with 3 (19%) of demand with terraced house and flat/apartment at 1(6%).
30.13 The highest need regarding tenure type is owner occupier with 14 (88%) followed by private rented 1 (6%) and 1 (6%) social rented in the next five to ten years.
30.14 The table below shows a breakdown of dwellings required in the next 10 years.
Table 1 – Dwellings required in the next 10 years
| 0 | Owner occupier | Shared Ownership | Social Rent | Private Rent | Other | Unknown | Total | ||||||||||||||||||||||||||||||||||||||||||
|---|---|---|---|---|---|---|---|---|---|---|---|---|---|---|---|---|---|---|---|---|---|---|---|---|---|---|---|---|---|---|---|---|---|---|---|---|---|---|---|---|---|---|---|---|---|---|---|---|---|
| Property Type | 1 Bed | 2 Bed | 3 Bed | 4 Bed | 5 Bed | Supported accommodation | Other | Unknown | 1 Bed | 2 Bed | 3 Bed | 4 Bed | 5 Bed | Supported accommodation | Other | Unknown | 1 Bed | 2 Bed | 3 Bed | 4 Bed | 5 Bed | Supported accommodation | Other | Unknown | 1 Bed | 2 Bed | 3 Bed | 4 Bed | 5 Bed | Supported accommodation | Other | Unknown | 1 Bed | 2 Bed | 3 Bed | 4 Bed | 5 Bed | Supported accommodation | Other | Unknown | 1 Bed | 2 Bed | 3 Bed | 4 Bed | 5 Bed | Supported accommodation | Other | Unknown | |
| Semi-detached bungalow | 1 | 8 | 4 | 0 | 0 | 0 | 0 | 0 | 0 | 0 | 0 | 0 | 0 | 0 | 0 | 0 | 2 | 6 | 0 | 0 | 0 | 0 | 0 | 0 | 0 | 0 | 0 | 0 | 0 | 0 | 0 | 0 | 0 | 0 | 0 | 0 | 0 | 0 | 0 | 0 | 0 | 0 | 0 | 0 | 0 | 0 | 0 | 0 | 21 |
| Detached bungalow | 0 | 7 | 4 | 0 | 0 | 0 | 0 | 0 | 0 | 0 | 0 | 0 | 0 | 0 | 0 | 0 | 2 | 0 | 0 | 0 | 0 | 0 | 0 | 0 | 0 | 0 | 0 | 0 | 0 | 0 | 0 | 0 | 0 | 0 | 0 | 0 | 0 | 0 | 0 | 0 | 0 | 0 | 0 | 0 | 0 | 0 | 0 | 0 | 13 |
| Terraced house | 1 | 3 | 0 | 0 | 0 | 0 | 0 | 0 | 0 | 1 | 0 | 0 | 0 | 0 | 0 | 0 | 0 | 0 | 3 | 0 | 0 | 0 | 0 | 0 | 0 | 0 | 0 | 0 | 0 | 0 | 0 | 0 | 0 | 0 | 0 | 0 | 0 | 0 | 0 | 0 | 0 | 0 | 0 | 0 | 0 | 0 | 0 | 0 | 8 |
| Semi-detached house | 0 | 6 | 4 | 1 | 0 | 0 | 0 | 0 | 0 | 0 | 1 | 0 | 0 | 0 | 0 | 0 | 0 | 0 | 3 | 0 | 0 | 0 | 0 | 0 | 0 | 1 | 0 | 0 | 0 | 0 | 0 | 0 | 0 | 0 | 0 | 0 | 0 | 0 | 0 | 0 | 0 | 0 | 0 | 0 | 0 | 0 | 0 | 0 | 16 |
| Detached house | 0 | 1 | 2 | 0 | 3 | 0 | 0 | 0 | 0 | 1 | 0 | 0 | 0 | 0 | 0 | 0 | 0 | 0 | 0 | 0 | 0 | 0 | 0 | 0 | 0 | 0 | 0 | 0 | 0 | 0 | 0 | 0 | 0 | 0 | 0 | 0 | 0 | 0 | 0 | 0 | 0 | 0 | 0 | 0 | 0 | 0 | 0 | 0 | 7 |
| Flat/apartment | 0 | 3 | 0 | 0 | 0 | 0 | 0 | 0 | 0 | 0 | 0 | 0 | 0 | 0 | 0 | 0 | 0 | 0 | 0 | 0 | 0 | 0 | 0 | 0 | 2 | 0 | 0 | 0 | 0 | 0 | 0 | 0 | 0 | 0 | 0 | 0 | 0 | 0 | 0 | 0 | 0 | 0 | 0 | 0 | 0 | 0 | 0 | 0 | 5 |
| Mobile home (permanently sited) | 0 | 0 | 0 | 0 | 0 | 0 | 0 | 0 | 0 | 0 | 0 | 0 | 0 | 0 | 0 | 0 | 0 | 0 | 0 | 0 | 0 | 0 | 0 | 0 | 0 | 0 | 0 | 0 | 0 | 0 | 0 | 0 | 0 | 0 | 0 | 0 | 0 | 0 | 0 | 0 | 0 | 0 | 0 | 0 | 0 | 0 | 0 | 0 | 0 |
| Other (please specify) | 0 | 0 | 0 | 0 | 0 | 0 | 0 | 0 | 0 | 0 | 0 | 0 | 0 | 0 | 0 | 0 | 0 | 0 | 0 | 0 | 0 | 0 | 0 | 0 | 0 | 0 | 0 | 0 | 0 | 0 | 0 | 0 | 0 | 0 | 0 | 0 | 0 | 0 | 0 | 0 | 0 | 0 | 0 | 0 | 0 | 0 | 0 | 0 | 0 |
| No Details | 0 | 0 | 0 | 0 | 0 | 0 | 0 | 0 | 0 | 0 | 0 | 0 | 0 | 0 | 0 | 0 | 0 | 0 | 0 | 0 | 0 | 0 | 0 | 0 | 0 | 0 | 0 | 0 | 0 | 0 | 0 | 0 | 0 | 0 | 0 | 0 | 0 | 0 | 0 | 0 | 0 | 0 | 0 | 0 | 0 | 0 | 0 | 0 | 0 |
| Total in next 10 Years | 2 | 28 | 14 | 1 | 3 | 0 | 0 | 0 | 0 | 2 | 1 | 0 | 0 | 0 | 0 | 0 | 4 | 6 | 6 | 0 | 0 | 0 | 0 | 0 | 2 | 1 | 0 | 0 | 0 | 0 | 0 | 0 | 0 | 0 | 0 | 0 | 0 | 0 | 0 | 0 | 0 | 0 | 0 | 0 | 0 | 0 | 0 | 0 | 70 |
Figure 30.15 - Breakdown of the housing need in the next 10 years.
30.15 Therefore, the demand in Wolverley & Cookley in the next 10 years is 70 homes.
30.16 The largest need regarding the number of bedrooms required by is 2 bedrooms with 37 (54%) of the demand, followed by 3 bedrooms with 21 (30%) with the lowest being 1 bedroom 8 (11%).
30.17 The highest need regarding property types is semi-detached bungalow 21 (30%), then semi-detached house with 16 (23%), detached bungalow 13 (19%) and terraced house 8 (11%), followed by detached house 7 (10%) with flats/apartments being least in demand at 5 (7%).
30.18 The highest need regarding tenure type is owner occupier 48 (69%) followed by social rent 16 (23%). There was little demand for private rent and shared ownership which were both 3 (4%).
Section 7: House Price, Availability and Analysis
This section breaks down what respondents are willing to pay and what properties are currently available within the town.
31. House prices
31.1 Respondents who have indicated that they have a housing need in the next 10 years were asked how much they felt they would be willing to pay if either renting or purchasing a property.
31.2 There were 33 responses (multiple households could answer) in total who advised they would be looking to rent. Out of those 7 (21%) were able to afford up to £500 per month and a further 7 (21%) indicated they could afford up to £800 per month, although 6 (18%) indicated affordability of more than £901 per month. The table shows a breakdown of affordability in renting and combines residents who are looking for alternative or additional accommodation and people with a local connection who want to return to Wolverley & Cookley.
How much could you afford if renting a new property?
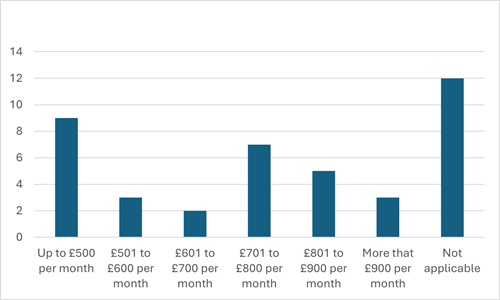
Figure 31.3 – Affordability range for renting in the next 10 years
31.4 There were 37 responses in total who advised they would be looking to purchase. In terms of purchasing a property, the highest response rate in the affordability category for alternative or additional accommodation and people with a local connection who want to return to Wolverley & Cookley was £200,001 - £250,000 with 19%, 16% specifying £90,001 to £150,000. There was then an equal split across the remaining price brackets with 8% indicating affordability of £250,001 to £300,000, a further 8% indicated affordability over £500,000 and 8% also indicated an interest in shared ownership, 5% of respondents indicated affordability of £150,001 to £200,000 with 3% in both the £350,001 - £400,000 and £450,001 - £500,000 price brackets. 30% did not respond to this question.
31.5 How much could you afford if purchasing a new property?
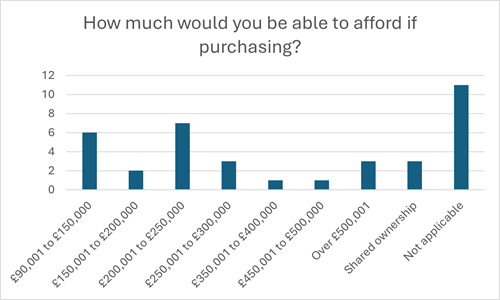
Figure 31.6 – Affordability range for purchasing a property in the next 10 years.
31.7 Research on Rightmove indicates that as of October 2025 there were 52 properties for sale in Wolverley & Cookley and 0 properties available to rent, 9 of the properties advertised for sale fall within the requirements specified in the responses received. Of the current advertised properties 1 would be suitable for respondents in the next 12 months, an additional 7 of these properties would be suitable in the next 13 months to 5 years and an additional 1 of these properties would be suitable in the next five to 10 years. There were no available properties currently for rent in Wolverley & Cookley, so therefore we were able to match respondents’ answers. (Figures from Rightmove)
31.5 This indicated there is some disparity between what people could afford to purchase in Wolverley & Cookley and what is available, this is not uncommon and would indicate a need for a greater number of smaller homes and other affordable forms of housing.
31.6 The map shows the properties for sale in Wolverley & Cookley in October 2025.
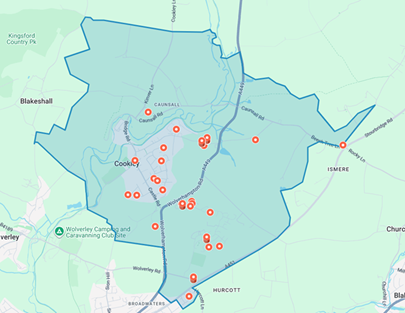
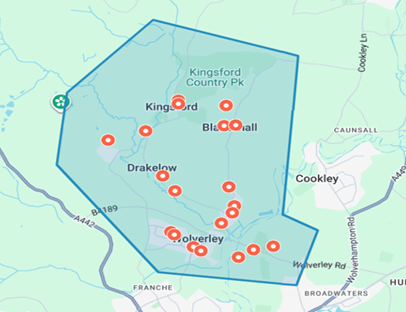
Properties currently for sale on Rightmove in Wolverley & Cookley.
31.7 Appendix three shows a breakdown of the properties for sale and asking price currently on Rightmove October 2025.
Section 8: Community Led Housing Scheme and Self-Build
This section addresses if respondents would be interested in taking a role in community led housing schemes or have an interest in a self-build project.
32. Would you be interested in taking a role in a community led housing scheme in Wolverley & Cookley?
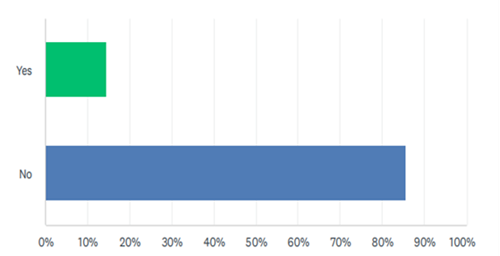
Figure 32 – Would you be interested in taking a role in a community led housing scheme in Wolverley & Cookley.
32.1 173 respondents answered this question with the majority of 86% (148) advising No and 14% (25) answering Yes.
33. Would you be interested in a self-build project or having a custom build house in Wolverley & Cookley?
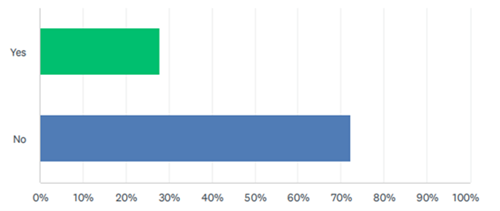
Figure 33 – Would you be interested in a self-build project or having a custom build house in Wolverley & Cookley.
33.1 173 respondents answered with the majority 72% (125) not interested in a self-build project and 28% (48) who would be in favour of having a custom build house in the parish.
Section 9. Conclusion
34.1 Taking into consideration the breadth of the survey and the range of responses received, there is statistically significant sets of data generated to enable us to evaluate the information and draw conclusions. There was an overall response rate of just under 8% achieved.
34.2 Of the responses 97 indicated they wanted to move or required additional or alternative accommodation, the demand was as follows: - 53 would like alternative accommodation, 36 responses indicated that 36 additional properties would be required.
34.3 14 out of 111 responses advised they wanted to move back to Wolverley & Cookley with a local connection, 22 residents indicated they would be looking for 1 additional property within the parish, with 14 requiring 2 additional/alternative properties to move or homes within the next 10 years.
34.4 The survey is also representative of a diverse cross section of the local community, including young people, single people, families and older households. Note there is a higher response rate by households that include single and couples accommodating larger properties (3 bedroom plus) looking to move to bungalows or smaller accommodation 12% (68). This should be of note when identifying housing need for Wolverley & Cookley.
34.5 Of the 111 responses who indicated they wanted to move, could potentially have their accommodation needs met by natural churn. Those that required additional accommodation could have their needs met from properties currently on the open market or natural churn. However, it must be noted that not all those whose housing needs can be met with natural churn will be able to afford the properties on the open market or that the properties available will be of a desired size, therefore it is evident that the need for new affordable housing will become greater especially for low-cost home ownership products. Therefore, the survey shows that a minimum of 70 additional homes will be required in Wolverley & Cookley over the next 10 years.
34.6 The findings of the Housing Needs Survey support development opportunities that should arise. This survey clearly indicated that any development sites or new build accommodation they must include affordable housing for rent or shared ownership (or other types of low-cost) homes in line with planning policy.
34.6 Accommodation should be a mix of 2 and 3 bedroom properties with respondents specifying a lack of bungalows within the area, 59% advised that they would want a 2-bedrooms property with 25 % requiring a 3-bedroom property, with a 10% demand for 1 bedroom properties. The highest need regarding types of property is houses 48%, closely followed by bungalows 15% and then flats/apartments at 7%. Since the last survey was conducted it is apparent there is now a higher demand for houses as whereas it was previously bungalows. The highest need regarding tenure type is owner occupier 65% with of the demand, followed by affordable/social rented with 23%, shared ownership 7% and then private rented with 4%.
References
Rightmove
Census 2021 data www.ons.gov.uk/visualisations/customprofiles/build/
Waiting list data – Shelter.co.uk
Average rental price – home.co.uk